
If you haven’t already done so, you should read the Verizon Data Breach Investigations Report that they publish annually. In the 2018 Verizon DBIR, it is chock-full of good reading around the specifics of breaches in 2017 and provides an insight to the Who, How, Why, What, and When. In the report you can read about the internal threat actors down to how malware was distributed. In all, Verizon has dotted all the I’s and crossed all of the T’s and provided you visibility into 53,000 incidents and 2,216 confirmed breaches across all verticals in 2017. Historically I have used these reports to help educate myself and my customers on the threat landscape as well as leverage the information to help justify spend on security related products, tools, or services to help keep the enterprise safe.
While reading the report, the sections regarding malware (ransomware included) stood out to me. Why? Well come on, you would think by 2017 will all of the security tools deployed that malware, even 0-day, wouldn’t be an issue but it still is. On pages 17/18, the report discusses the frequency of malware vectors, or basically how malware is distributed.
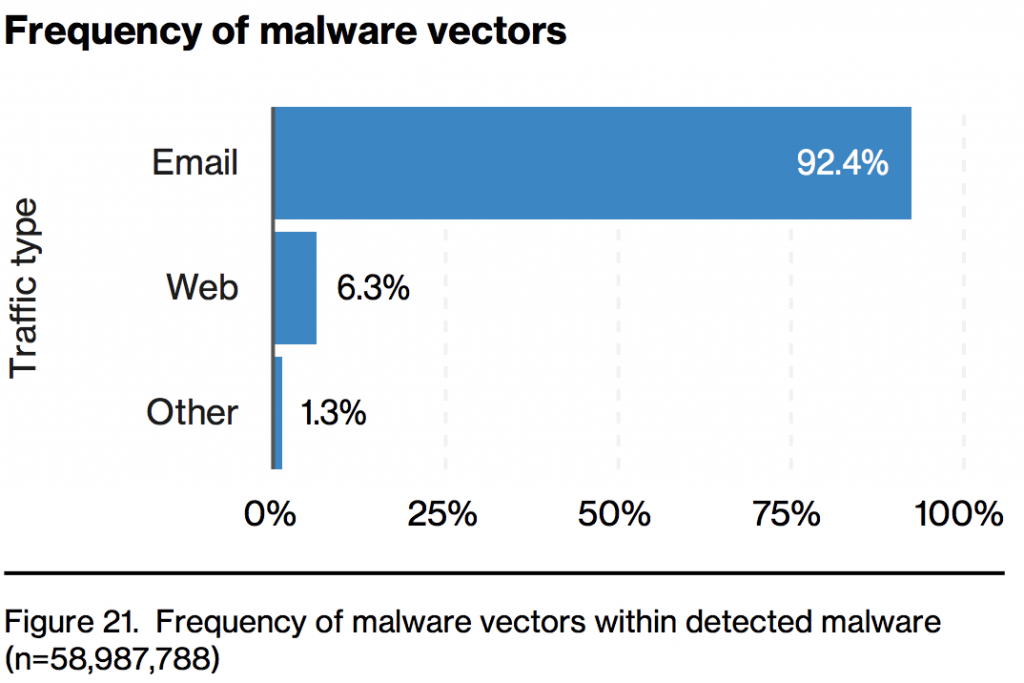
So right off the bat, looking at that infographic you would immediately think that any money spent on your mail gateway and subscriptions just paid for itself. And you’re right, that is an insane catch rate. But why is there such a huge discrepancy between email and web? For a lack of better words, your mail gateway is a proxy and operates at L7. It has the ability to inspect the entire payload of the email and look for malware. Now look at your perimeter, specifically web based traffic. For your users going out to the Internet, how do you protect those users? You are likely using a NGFW and/or a SWG to inspect traffic. Now for the million dollar question; Why is web only detecting 6.3% of all malware? The answer is simple, it comes down to visibility. Are you inspecting all SSL/TLS traffic with the exception of categories such as Finance, Health, and Government all the time? While I cannot speak for the customers in this report, I can tell you with 100% certainty, every prospect that I have spoken with in the past year and a half isn’t inspecting SSL/TLS traffic everywhere all the time. Let’s look into why.
“SSL Inspection is difficult for us. When we do inspection, everything seems to break and causes problems with our users. We end up having to maintain a SSL whitelist.”
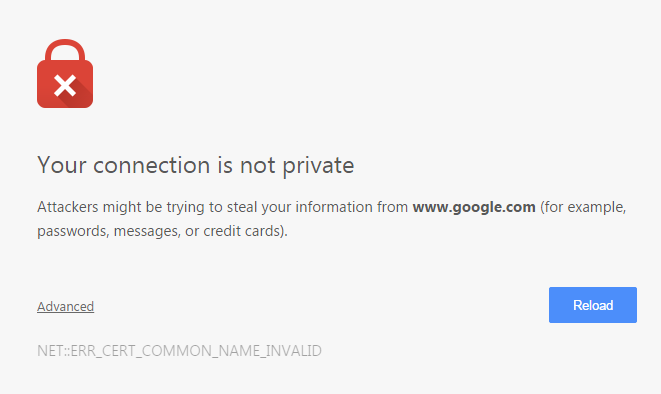
You would be surprised how many people will attempt to turn on SSL/TLS inspection without distributing the root CA to the users devices. Users end up seeing errors in the browsers and end up opening tickets because they have to click through or don’t feel safe.
Another issue related to SSL/TLS inspection is HTTP Public Key Pinning (HPKP) and the lack of understanding around the functionality. When a website and/or app has this enabled, it makes it impossible to inspect the traffic as the client is expecting a specific certificate. For most companies, they will opt out entirely of SSL/TLS inspection because of the unknown. This is often a subject I talk extensively about when introducing the concept of SSL/TLS inspect. The goals is to help the customer understand exactly what is going on, how to troubleshoot it, and to provide them with a strategy to adopt SSL/TLS inspect without causing outages, or simply put “Bad User Experience”.
That’s all fine and dandy Brian, but do we really need to inspect SSL/TLS? In short, WITHOUT A DOUBT. Encryption is everywhere, don’t believe me? Let’s look at the Google Transparency Report:
What percentage of your web traffic is encrypted? I can conservatively say that 80%+ of your web traffic is currently encrypted. According to Google, it’s around 86% for the US.
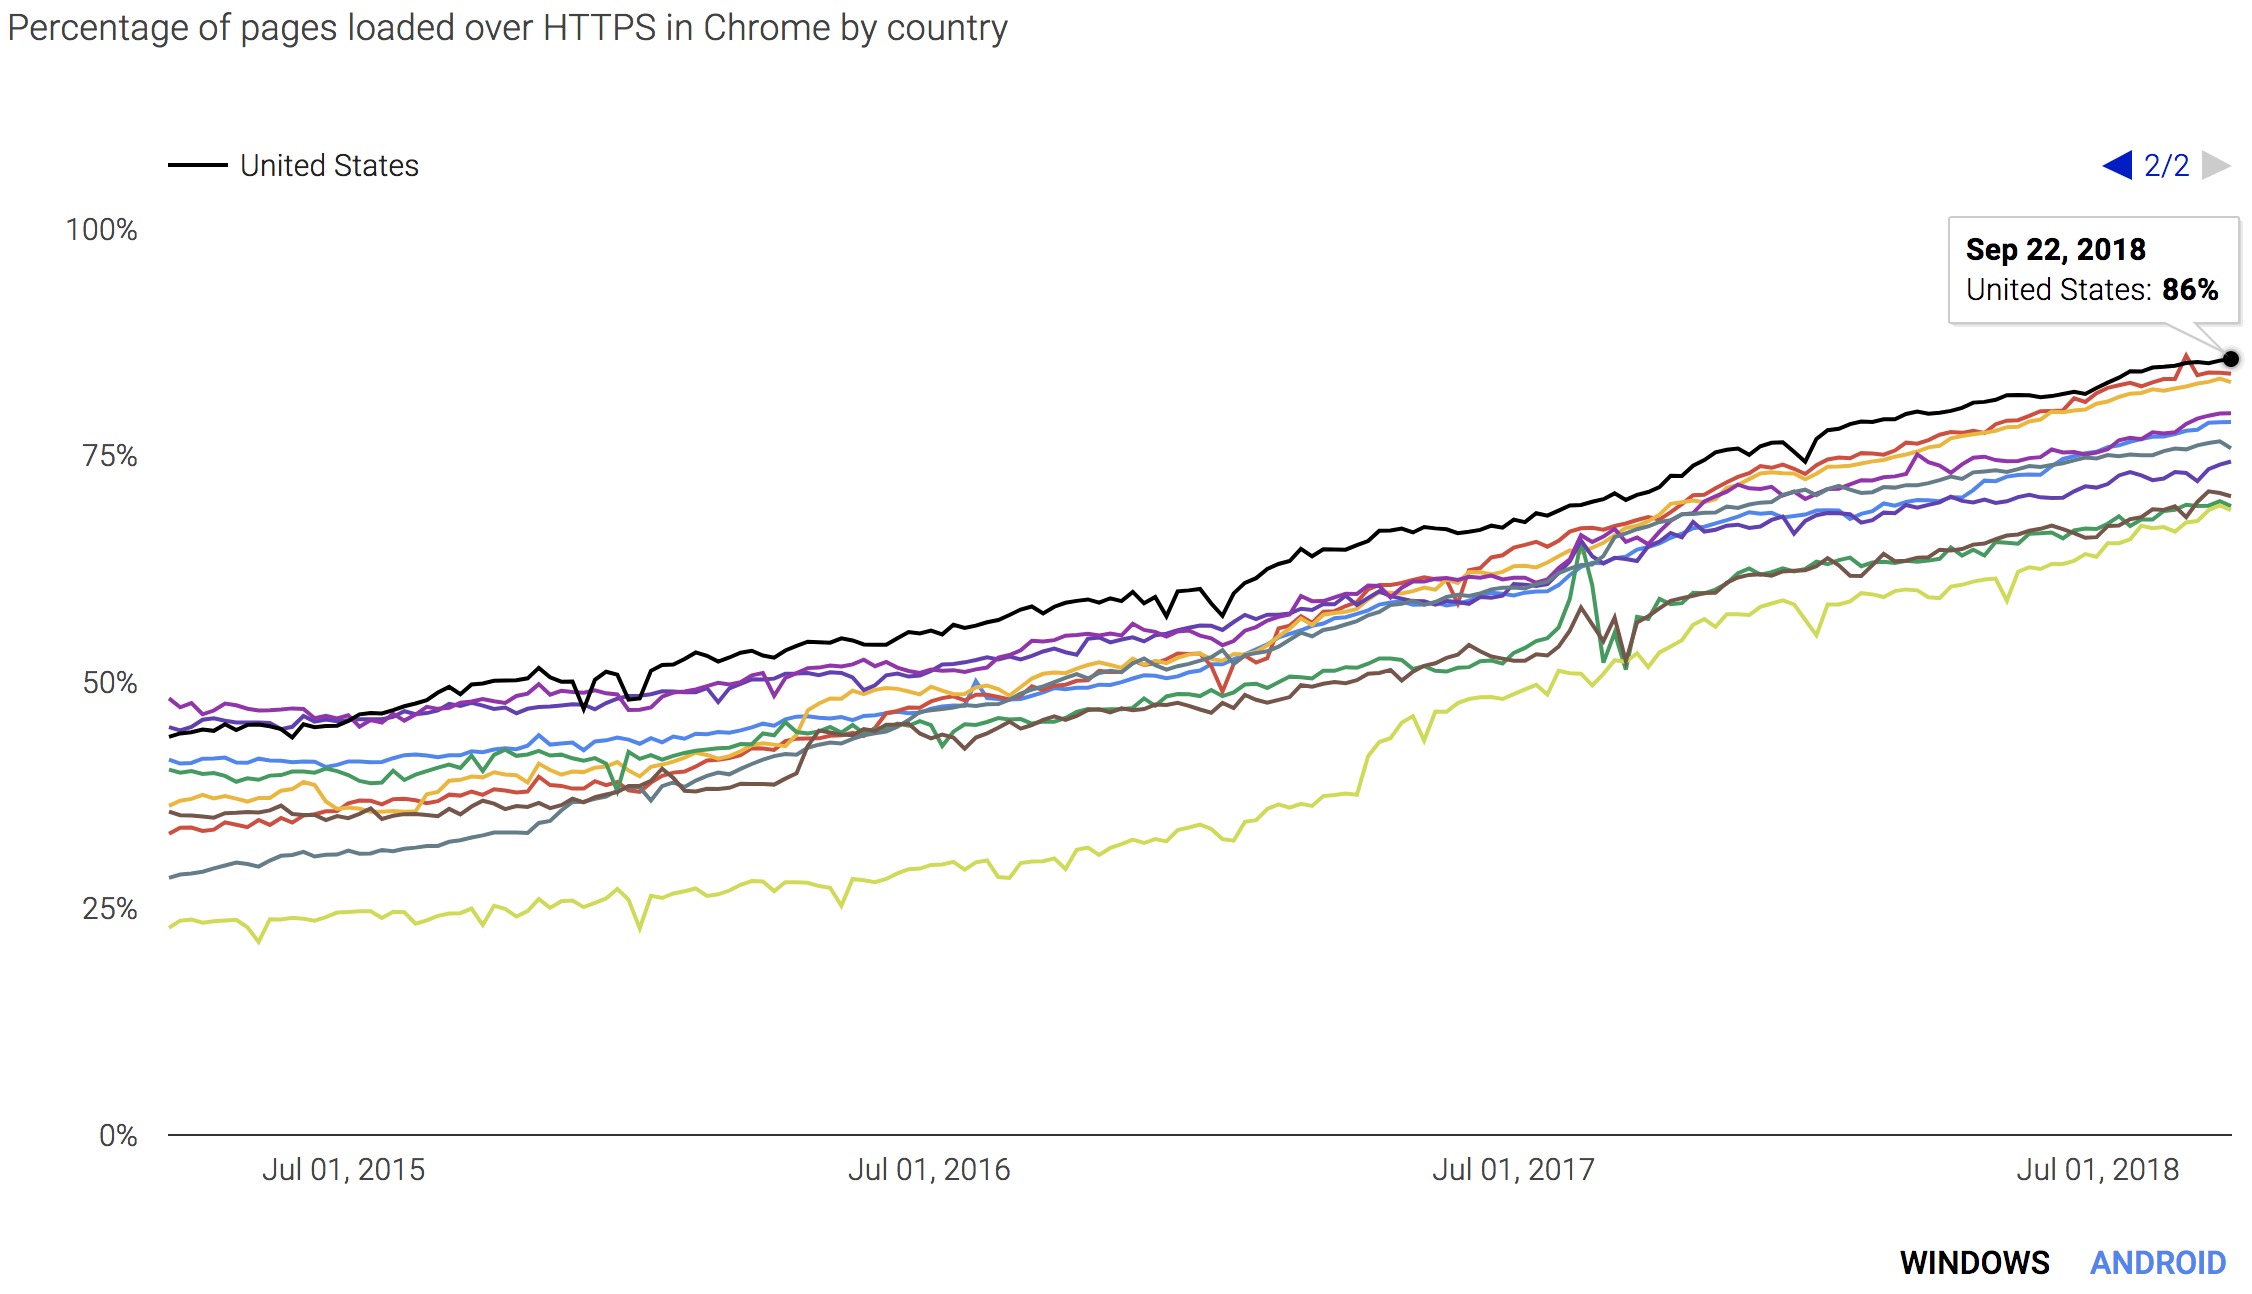
That means if you are not inspecting SSL/TLS, you are effectively blind to 80%+ of all your Internet bound traffic. Many customers will tell me that they have a strict policy of what websites (categories) are allowed to be used at work. I will then ask customers, do you allow Content Delivery Networks (CDNs) in your policy? The answer is always “Yes”. It is not because they are nice it’s because so many websites would break if you blocked CDNs. If you are allowing CDNs and you are not inspecting SSL/TLS, that means anything from a CDN would be considered safe since you can only see the host name. You are blind to anything past the .com:
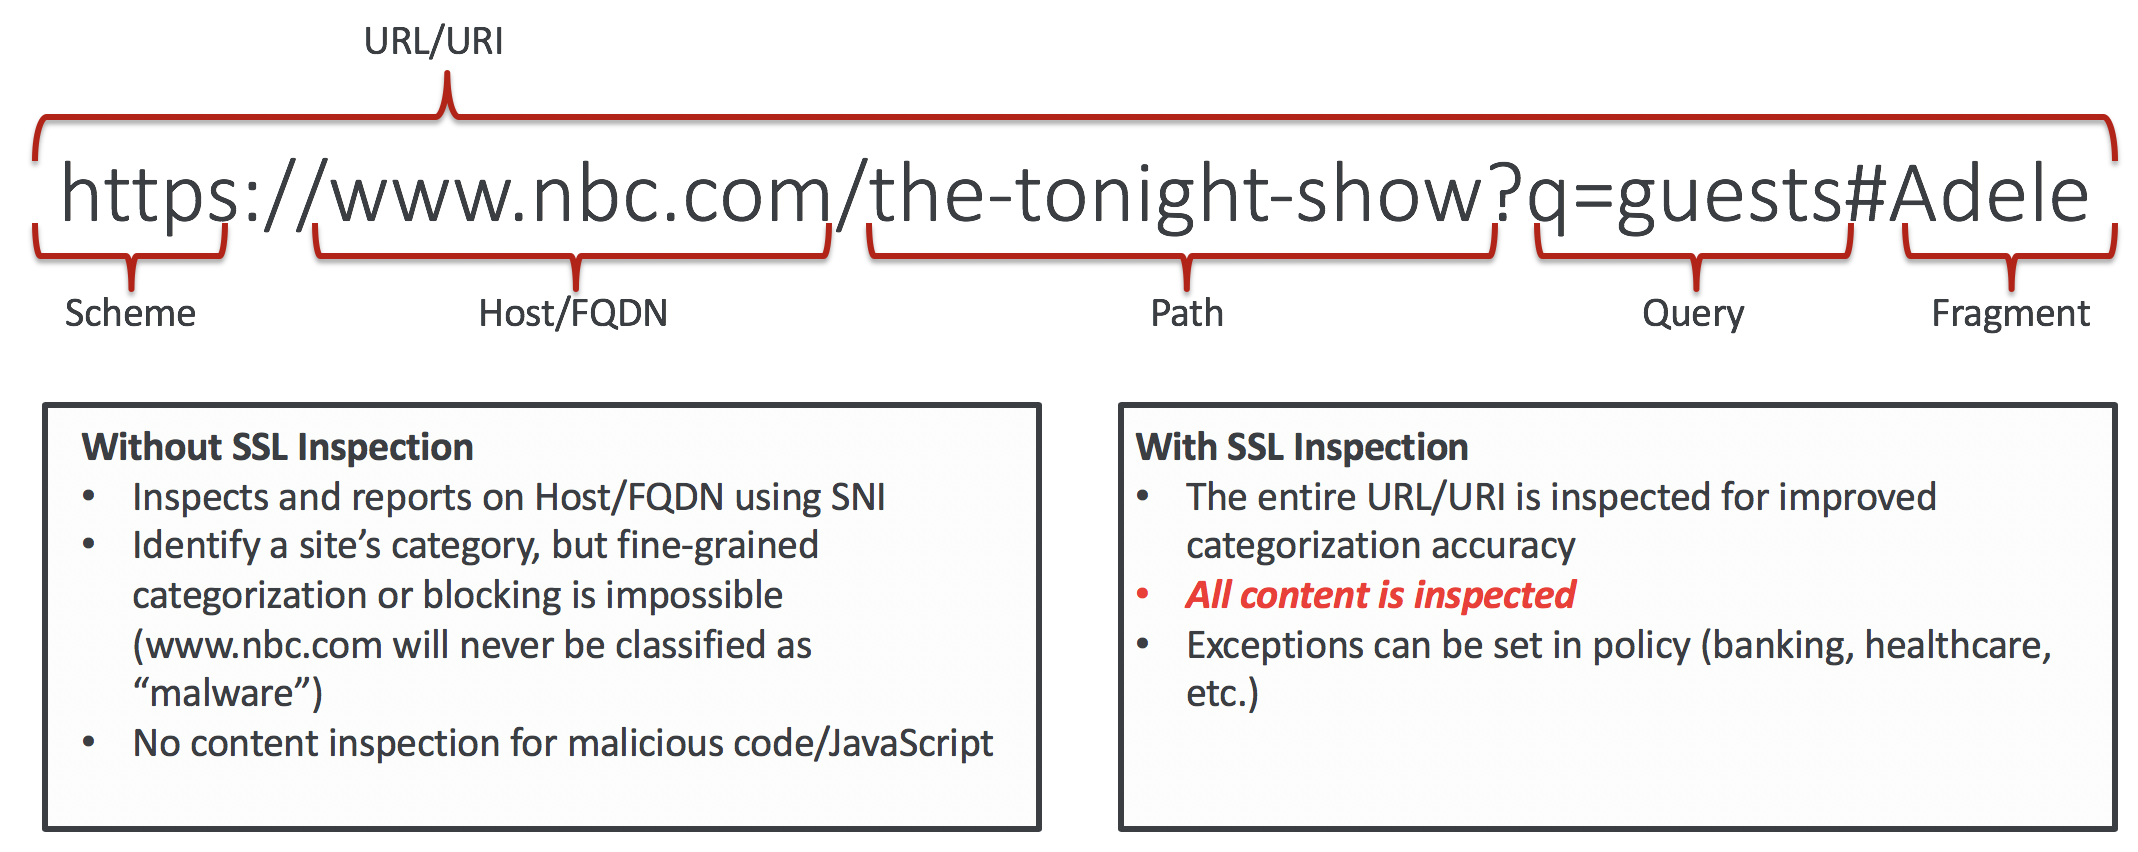
For what it is worth (surprise, it’s a lot), CDNs make up on average, 65% of any given web page content. And no, said content isn’t being loaded over http. If the website you are on has https, the CDN is delivering content over SSL/TLS as well. Otherwise you’d see error messages such as “This page contains both secure and nonsecure items.”
You don’t have to believe me. There is plenty of evidence that supports this claim.
- New Attacks Abuse CDNs to Spread Malware-Security Week
- Content Delivery Networks Offer More Bandwidth, but Can Hide Malware-Security Intelligence
-
Implementing Malware Command and Control using Major CDNs and High Traffic Domains – CyberArk
Another pain point regarding protecting users when they are off the corporate network. Most customers will claim to have an “always on VPN”, but we all know there is no 100% adoption rate when it comes to that solution. Anything you put on an end users device that slows them down or makes for a poor user experience, will ultimately be removed or disabled by the end user and VPN is notoriously known for all of the above. That is why it is critical to have the ability to enforce the exact same security policy for all users when they are at work, home, or abroad. The trick is, it must be transparent, involves no user interaction, and interoperable with AUP on public wifi.
Insert Zscaler plug here =) consider using the 7 steps on exfiltration/infection and how it’s important to leverage SSL at every Stage [Graphics part of corporate Deck]
With all of that said, let’s circle back to the first infographic I used at the beginning of this article:
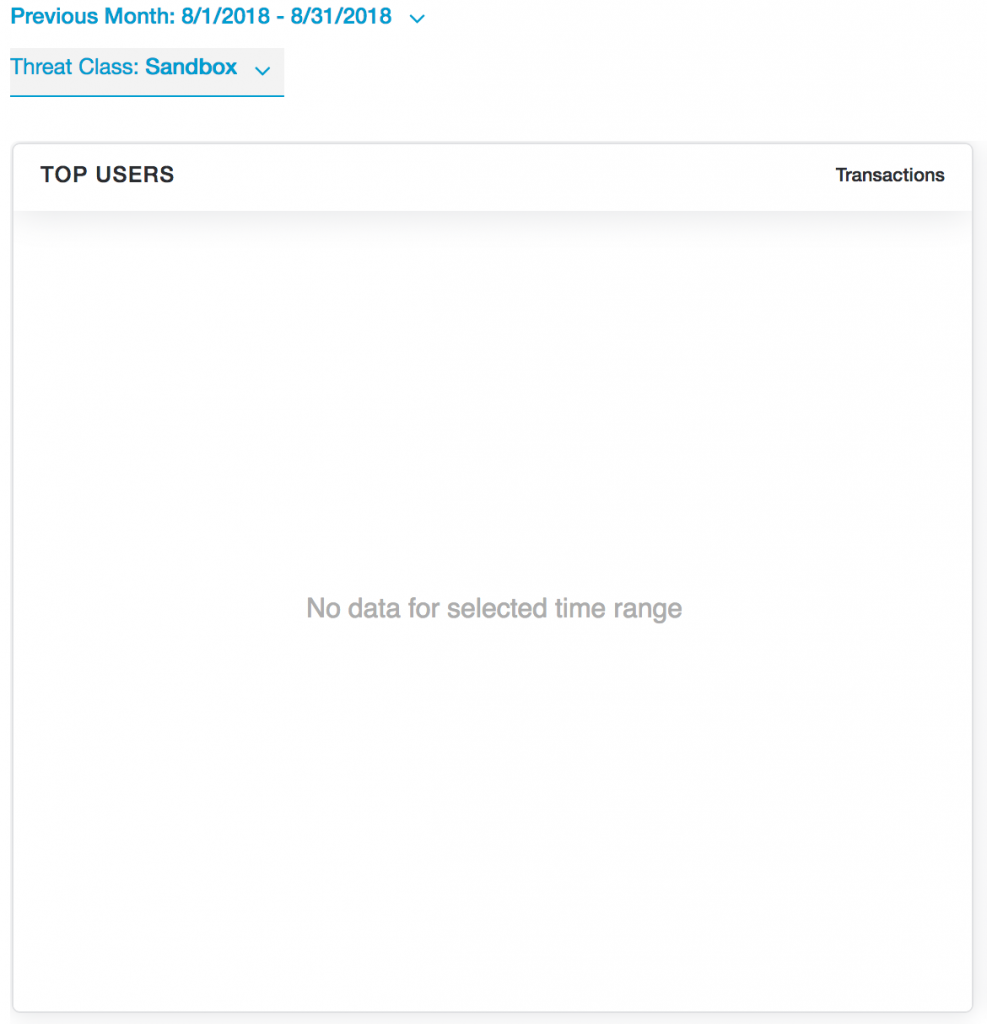
Once you enable SSL/TLS inspection, the Web vector will eventually eclipse the Email vector. Web was lower before because it was blind to 80%+ of the traffic and the metric was “detected” if that makes sense. Recently, I had a customer in a POC go from not doing SSL/TLS inspection to enabling it and was shocked to see the results. They only had 10 users on the POC and prior to enabling inspection, there were 0 cases of malware found:
Once we enabled SSL/TLS inspection, we found 157 instances where malware was being downloaded from a secure channel.
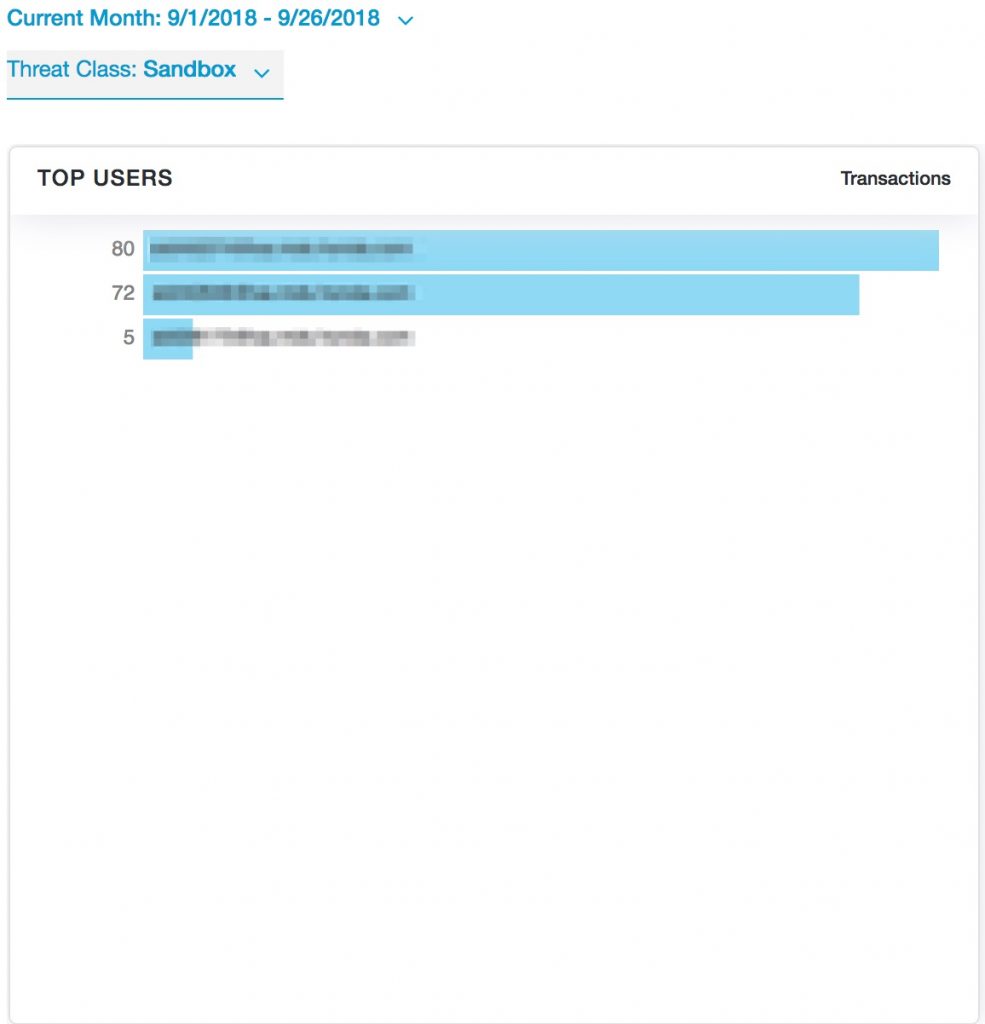
Please keep in mind, while only 3 users showed up in the reports there were only a total of 10 users total in the POC.
From the Barkley Threat Report Q2 2018:
MalspamDespite all the changes rippling across the threat landscape, one constant is that email continues to be the primary way malware is delivered. The volume of malicious emails distributing malware (malspam) has been increasing over the course of 2018, doubling from a rate of one in every 786 emails in January to one in every 376 emails in June (Symantec). Attackers are constantly shifting malspam tactics in order to stay one step ahead of security filters and successfully trick victims into taking the bait. Specific email themes, lures, and payload file types are often cycled through regularly, sometimes on a campaign-by-campaign basis. For example, while malicious script files (.vbs, .js, .jar, .wsf), Microsoft Office documents, and PDFs continue to be the most popular file formats for first-stage payloads, attackers also spent the first half of 2018 experimenting with a variety of other abusable file formats, including shortcut files (.lnk, .URL, .SettingContent-ms) and .iqy (Excel web query) files.URLs or file attachments?One significant change recorded by researchers at Proofpoint is a major swing back to URL-based malspam. While the majority of malspam campaigns in Q4 2017 used file attachments to distribute malware, during Q1 2018, the use of URLs to instead link to hosted payloads outnumbered that tactic by a ratio of 4 to 1. In the case of high-volume malspam campaigns, many of these decisions are up to the distributor. To gain deeper insight into that role let’s look closely at one malware distribution outfit in particular — Necurs, the world’s largest spam botnet — and examine how its operations over the course of 2018 reflect the larger trends in play.
Please note that I am not trying to say that the Verizon DBIR is incorrect, because it really isn’t. The metric used in the graph for email vs web was Detection. If you aren’t inspecting SSL/TLS, I would expect the detection rate to be very low given that a majority of web traffic is encrypted. I suppose there is only one way to find out right? Time to crack open that encrypted packet and see what is going through your outbound/inbound connections.
Regards,
BD